Position scales for discrete distributions
Source:R/scale-discrete-distribution.R
scale_discrete_distribution.RdThese scales allow for discrete distributions to be passed to the x and y position by mapping distribution objects to discrete aesthetics. These scale can be used similarly to the scale_*_discrete functions. If you want to transform your scale, you should apply a transformation through the coord_* functions, as they are applied after the stat, so the existing ggplot infastructure can be used.
Usage
scale_x_discrete_distribution(
  name = waiver(),
  palette = seq_len,
  expand = waiver(),
  guide = waiver(),
  position = "bottom",
  sec.axis = waiver(),
  continuous.limits = NULL,
  drop = TRUE,
  ...
)

scale_y_discrete_distribution(
  name = waiver(),
  palette = seq_len,
  expand = waiver(),
  guide = waiver(),
  position = "left",
  sec.axis = waiver(),
  continuous.limits = NULL,
  drop = TRUE,
  ...
)
Arguments
- name
The name of the scale. Used as the axis or legend title. If
waiver(), the default, the name of the scale is taken from the first mapping used for that aesthetic. IfNULL, the legend title will be omitted.- palette
A palette function that when called with a single integer argument (the number of levels in the scale) returns the numerical values that they should take.
- expand
For position scales, a vector of range expansion constants used to add some padding around the data to ensure that they are placed some distance away from the axes. Use the convenience function
expansion()to generate the values for theexpandargument. The defaults are to expand the scale by 5% on each side for continuous variables, and by 0.6 units on each side for discrete variables.- guide
A function used to create a guide or its name. See
guides()for more information.- position
For position scales, The position of the axis.
leftorrightfor y axes,toporbottomfor x axes.- sec.axis
dup_axis()is used to specify a secondary axis.- continuous.limits
One of:
NULLto use the default scale rangeA numeric vector of length two providing a display range for the scale. Use
NAto refer to the existing minimum or maximum.A function that accepts the limits and returns a numeric vector of length two.
- drop
TRUE, will drop factor levels not associated with data- ...
Arguments passed on to
discrete_scalebreaksOne of:
limitsOne of:
NULLto use the default scale valuesA character vector that defines possible values of the scale and their order
A function that accepts the existing (automatic) values and returns new ones. Also accepts rlang lambda function notation.
dropShould unused factor levels be omitted from the scale? The default,
TRUE, uses the levels that appear in the data;FALSEincludes the levels in the factor. Please note that to display every level in a legend, the layer should useshow.legend = TRUE.na.translateUnlike continuous scales, discrete scales can easily show missing values, and do so by default. If you want to remove missing values from a discrete scale, specify
na.translate = FALSE.na.valueIf
na.translate = TRUE, what aesthetic value should the missing values be displayed as? Does not apply to position scales whereNAis always placed at the far right.aestheticsThe names of the aesthetics that this scale works with.
minor_breaksOne of:
NULLfor no minor breakswaiver()for the default breaks (none for discrete, one minor break between each major break for continuous)A numeric vector of positions
A function that given the limits returns a vector of minor breaks. Also accepts rlang lambda function notation. When the function has two arguments, it will be given the limits and major break positions.
labelsOne of the options below. Please note that when
labelsis a vector, it is highly recommended to also set thebreaksargument as a vector to protect against unintended mismatches.NULLfor no labelswaiver()for the default labels computed by the transformation objectA character vector giving labels (must be same length as
breaks)An expression vector (must be the same length as breaks). See ?plotmath for details.
A function that takes the breaks as input and returns labels as output. Also accepts rlang lambda function notation.
callThe
callused to construct the scale for reporting messages.superThe super class to use for the constructed scale
Examples
library(ggplot2)
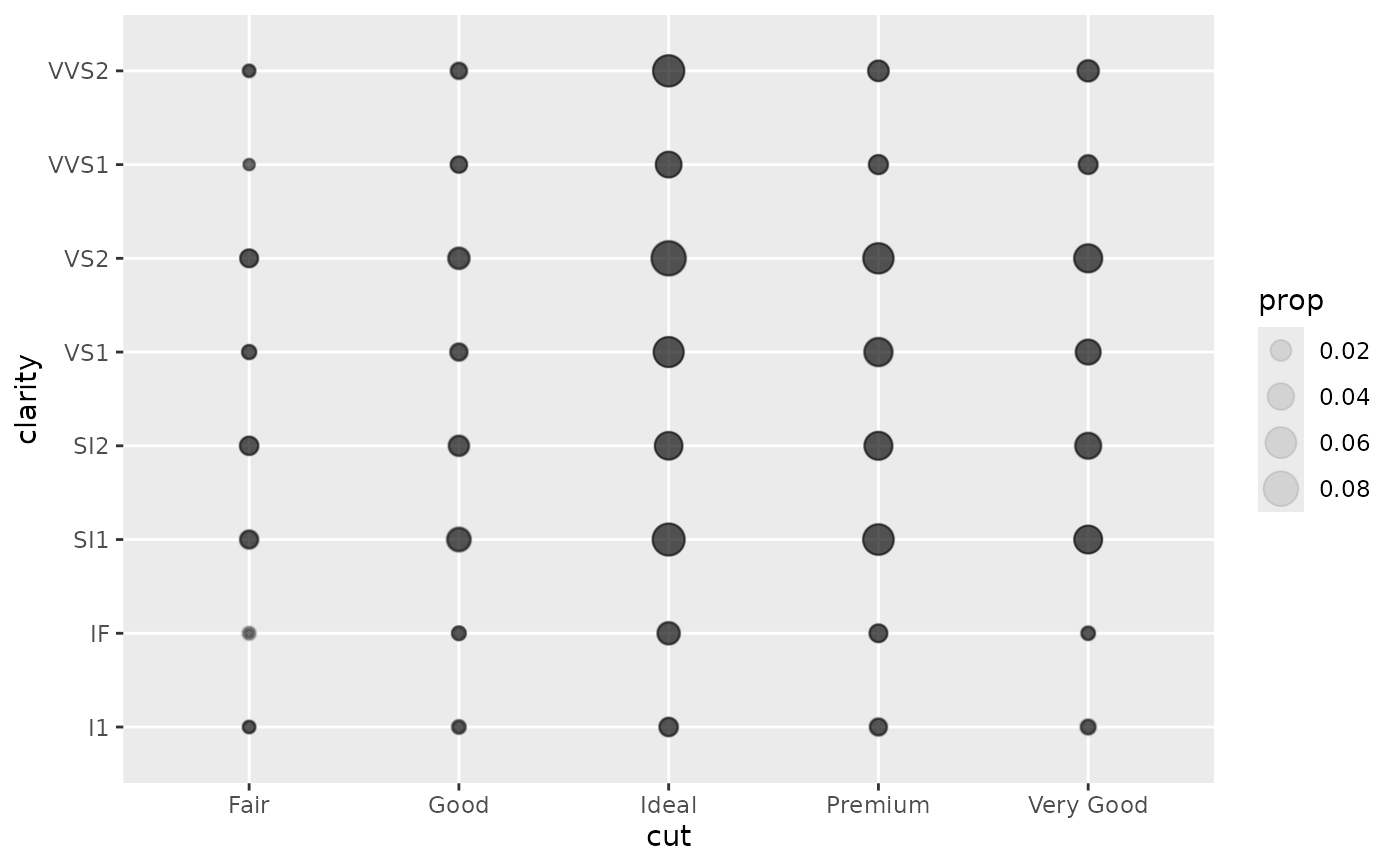
# ggplot
ggplot(smaller_diamonds, aes(x = cut, y = clarity)) +
geom_count(aes(size = after_stat(prop)))
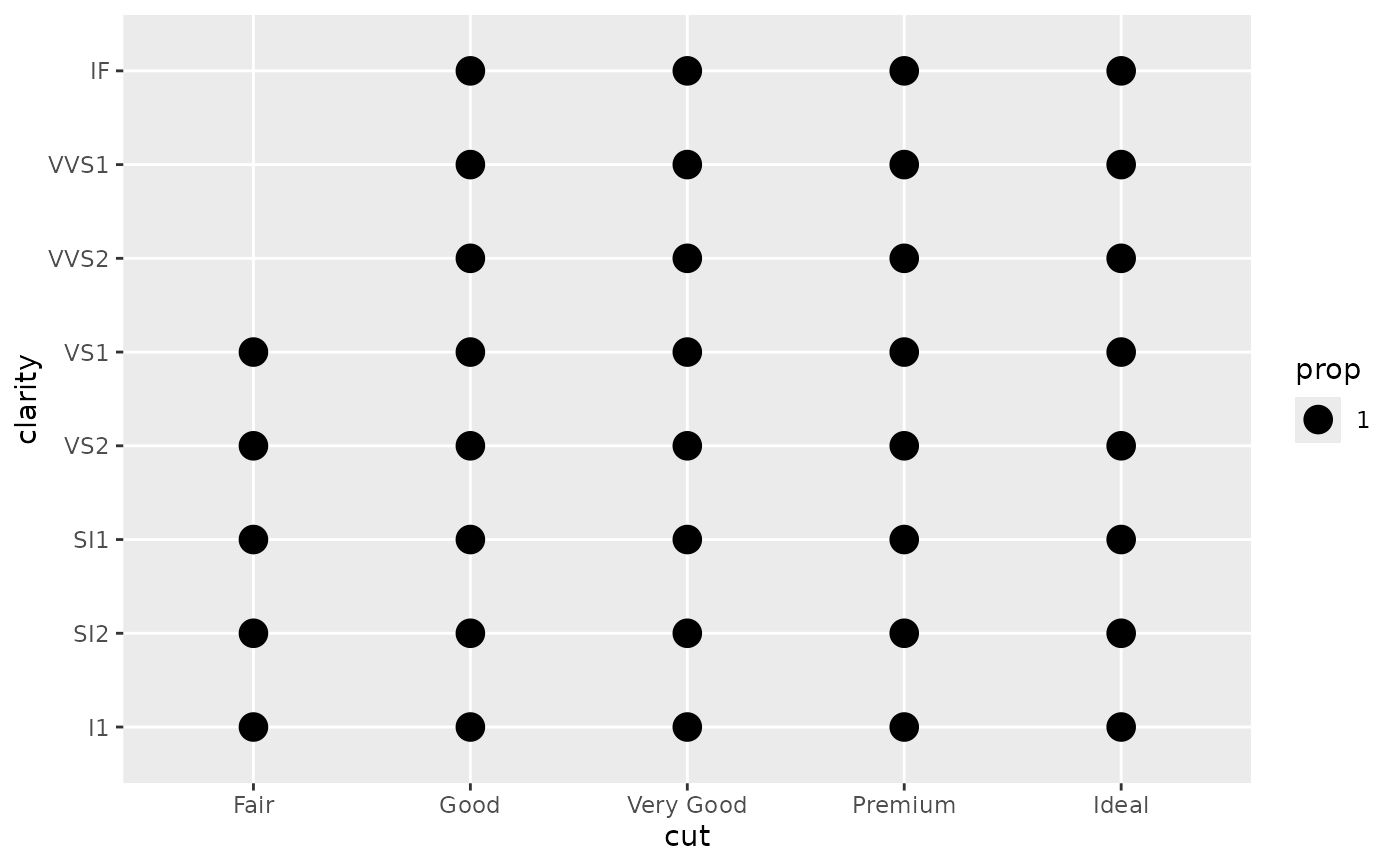 # ggdibbler
ggplot(smaller_uncertain_diamonds, aes(x = cut, y = clarity)) +
geom_count_sample(aes(size = after_stat(prop)), times=10, alpha=0.1)
# ggdibbler
ggplot(smaller_uncertain_diamonds, aes(x = cut, y = clarity)) +
geom_count_sample(aes(size = after_stat(prop)), times=10, alpha=0.1)