These functions use nested positioning for distributional data, where both of the positions are an identity. This allows you to set different position adjustments for the "main" and "distribution" parts of your plot.
Examples
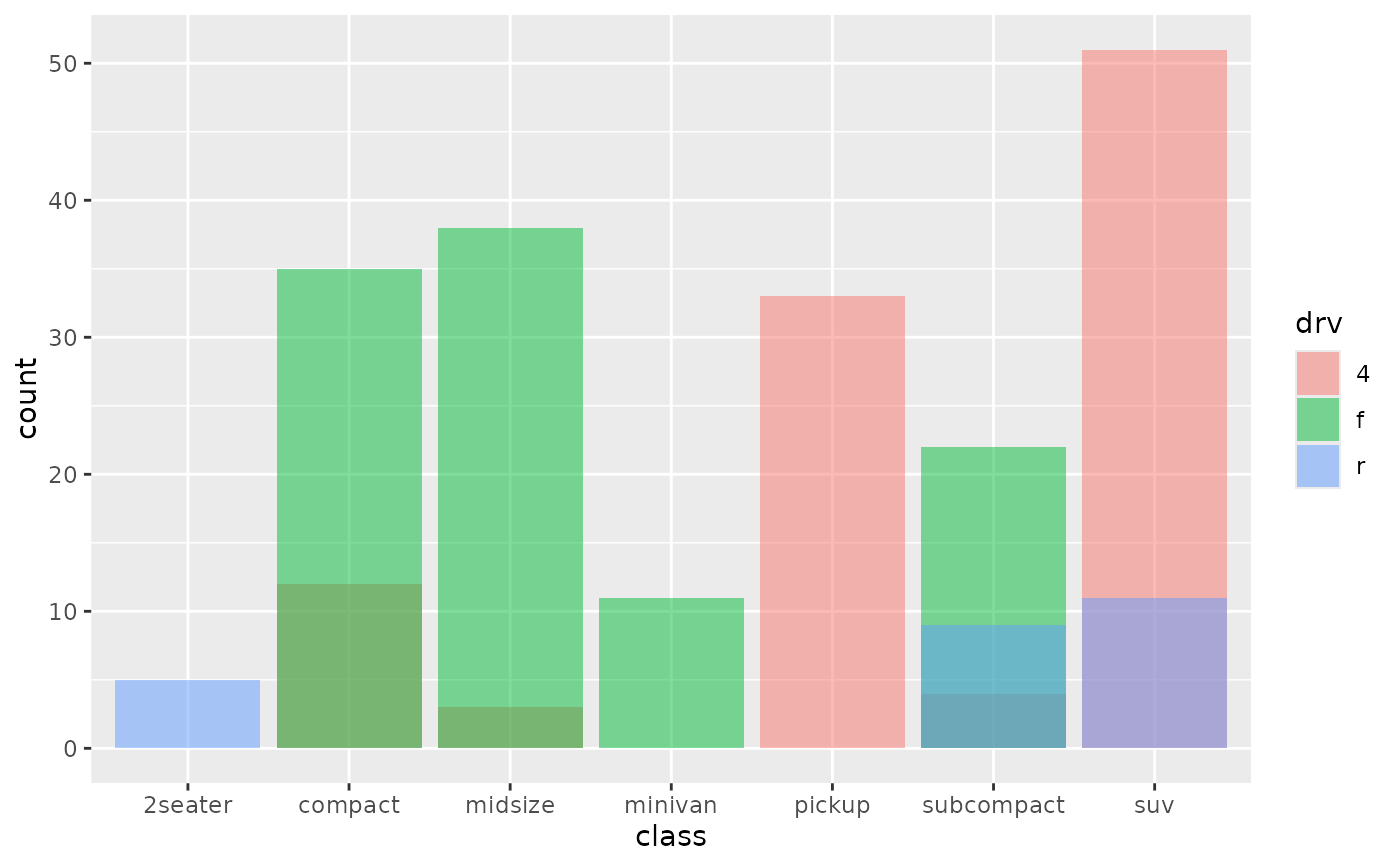
# Standard ggplots often have a position adjustment to fix overplotting
# plot with overplotting
library(ggplot2)
ggplot(mpg, aes(class)) +
geom_bar(aes(fill = drv), alpha=0.5,
position = "identity")
 # sometimes ggdibbler functions call for more control over these
# overplotting adjustments
ggplot(uncertain_mpg, aes(class)) +
geom_bar_sample(aes(fill = drv), position = "identity", alpha=0.1)
# sometimes ggdibbler functions call for more control over these
# overplotting adjustments
ggplot(uncertain_mpg, aes(class)) +
geom_bar_sample(aes(fill = drv), position = "identity", alpha=0.1)
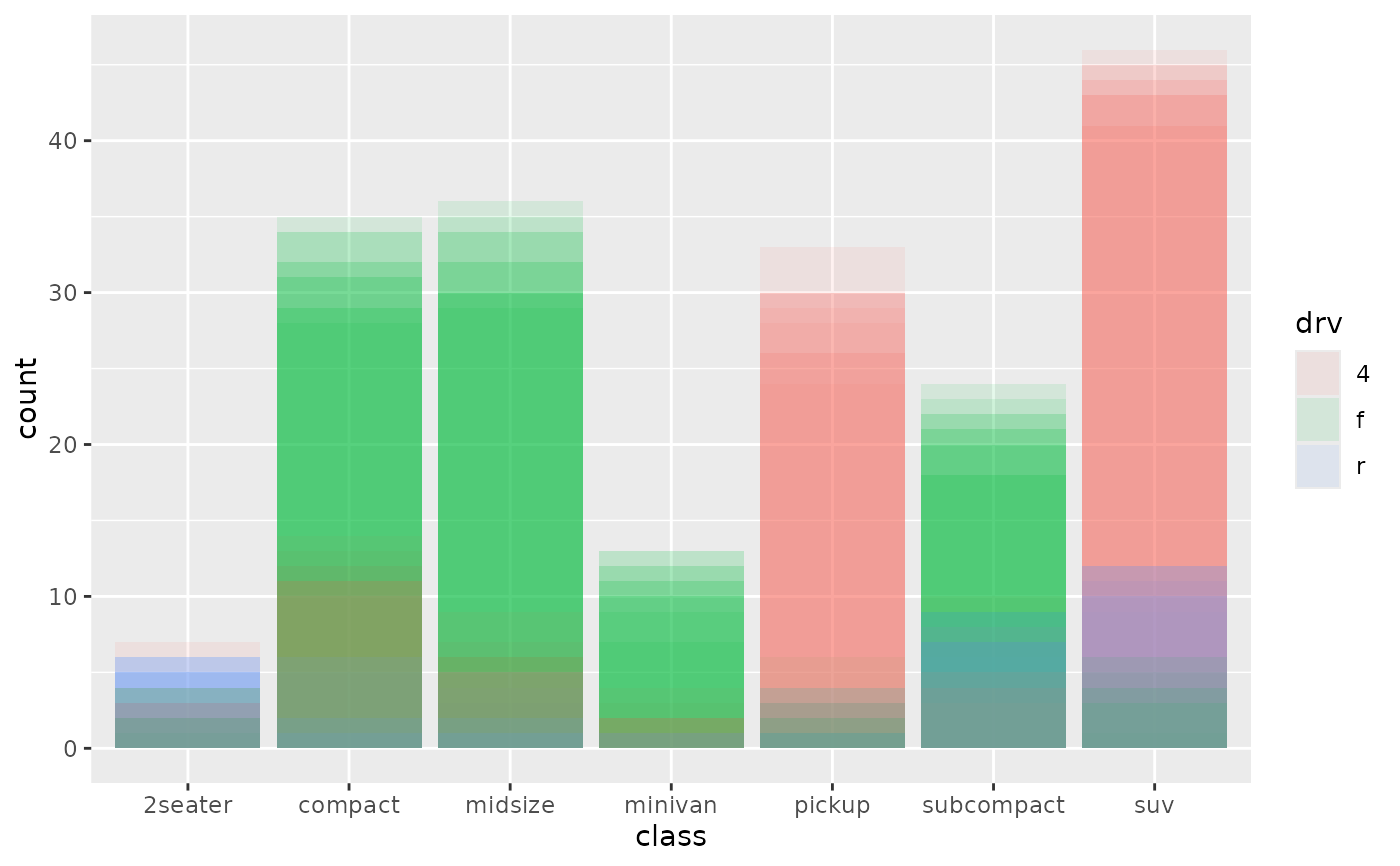 # is the same as...
ggplot(uncertain_mpg, aes(class)) +
geom_bar_sample(aes(fill = drv), position = "identity_identity", alpha=0.1)
# is the same as...
ggplot(uncertain_mpg, aes(class)) +
geom_bar_sample(aes(fill = drv), position = "identity_identity", alpha=0.1)
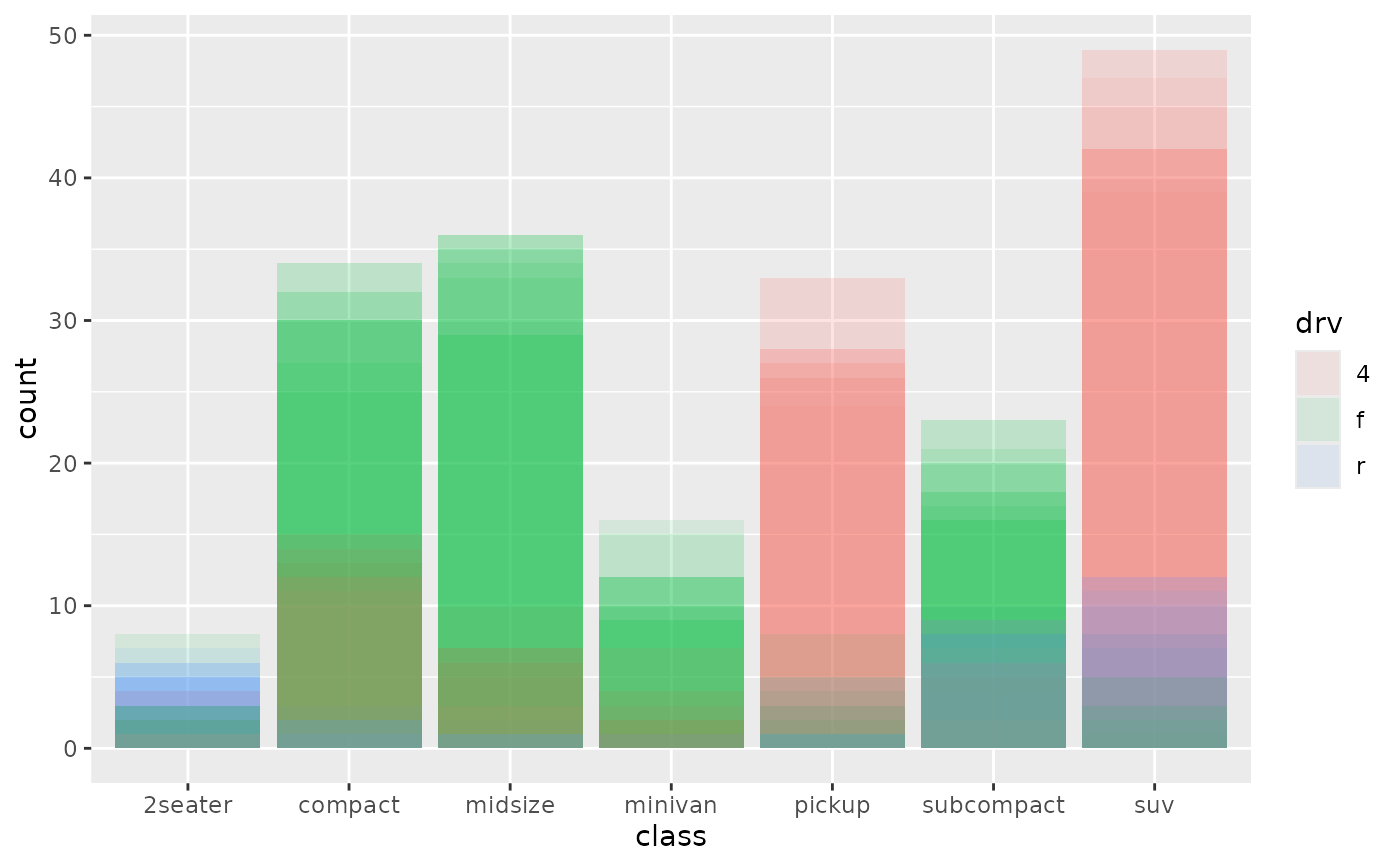 # nested positions allows us to differentiate which postion adjustments
# are used for the plot groups vs the distribution samples
# nested positions allows us to differentiate which postion adjustments
# are used for the plot groups vs the distribution samples